meso·pixel    

Early August

Library-o-photos

I recently was recently contemplating whether to take my non-phone camera on a trip, and that got me thinking about just how much my photo taking behaviour has changed the last couple years with the rise of really competitive phone cameras. My library of photos dates back to about 2004 and is now about 28k photos large, but it's mostly manageable with the help of Lightroom which I quite enjoy using (performance/subscription issues aside). And luckily for me, Lightroom also has a side benefit of having it's catalogue be a raw SQLite database, which means that we can actually sidestep having to parse RAW files and dealing with EXIF data directly if we want to analyze our photo library.

I couldn't find a good schema for the .lrcat catalogue online, but poking around the database itself suggests that most of the data we want can be resolved from the following few tables:

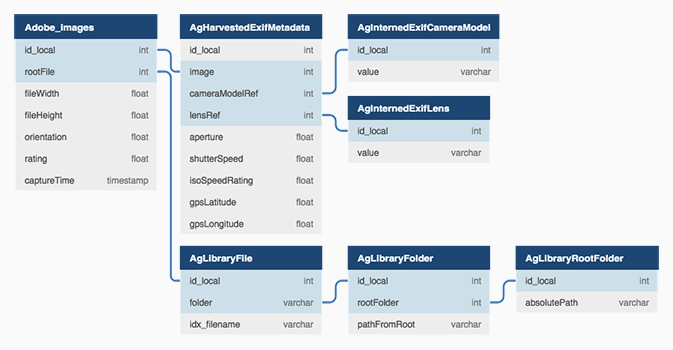
Lightroom catalogue schema (.lrcat)

From there, it's pretty easy to pull the data out into Python to grab some stats with Pandas and Matplotlib.

Photos by camera type over time and proportion of point & shoot photos of the entire library
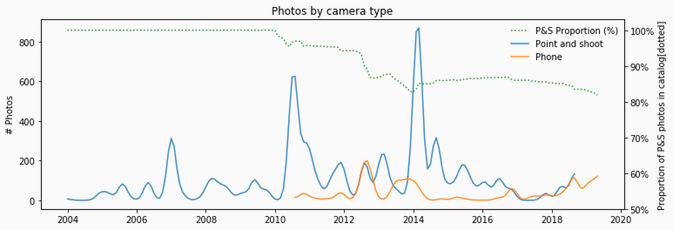
Photos by camera type over time, and proportion of non-phone camera photos in the library

As the chart shows, I didn't really start using phones to take photos until 2010-ish, back when phone camera photos were grainy and blurry in anything but the best lighting situations. But it's pretty clear that the best camera you have is the one you have on you, and nowadays, they are comparable with most point & shoot cameras. The peaks in the non-phone cameras, correspond to either new cameras I got prior to taking trips abroad or other photo-related projects (like an orchid flowering timelapse). Proportionally though, my non-phone photos are now down to 80% of my total library.

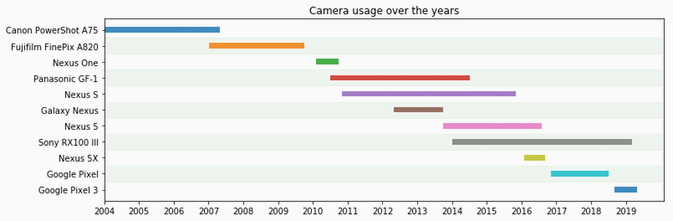
Individual camera usage over time

Looking at each camera usage over time, we can see that on average I end up using most non-phone cameras for about four years, with a number of different phones in between – mainly because I need to upgrade phones for work. As phone camera technology has gotten better, the need to update my non-phone camera has also diminished. At this point, I'm pretty happy with my RX100 and can see myself using it for quite a while longer. What the chart doesn't show though is just how much I shot with each camera.

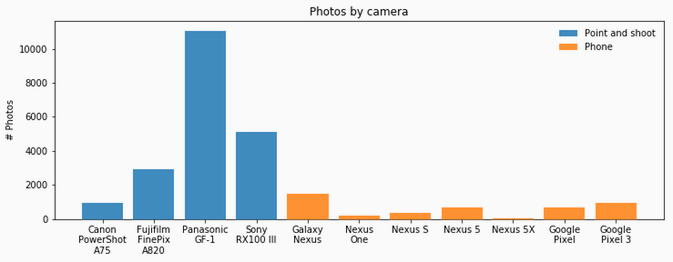
Number of photos taken by each individual camera

Looking at the shots by camera, it's pretty clear that I loved using the GF-1! It's a beautiful camera with intuitive menus in a really convenient form factor (micro four-thirds). I've always really loved the colors that came out as well, and especially liked the 20mm pancake lens. The only downside was the price and speed of the other lenses and that it was only 12MP. Prior to that, I also really liked my A820. I bought it during my first internship in the bay area and I explored a lot of Emeryville/Berkeley/Oakland and SF with it. Maybe because it didn't have too many features to distract you with, I always felt that I spent more time on composition in the pictures from that time. The RX100 I use now is solid – there's perhaps no other word to describe it because it's technically amazing (20MP in a 1 inch sensor), has a fast lens and even faster autofocus. I wouldn't necessarily describe it as a fun a camera to shoot with, but it's very reliable.

As for my phone cameras, I clearly used my Galaxy Nexus a lot (replaceable batteries!), and the Pixel/Pixel 3 are just downright amazing. I've been using Night Sight in some pretty dark environments and they manage to pull out some amazing shots for having such tiny sensors. Phone photos always end up looking like phone photos (a fixed lens, can't really blame it), but with the multi-lens/telescoping phones coming out soon, it'll really only get better.

Megapixel & file size growth over time

It's not all roses though, with each megapixel bump of each camera, the size of each file and the entire library grows. The entire library is about 250gb now with both photos and video. The difference between the solid and dotted lines on the chart reflect (approximately) the compression factor of the files for each camera type. And the 20MP lossy RAWs are quite a bit larger than the comparative JPGs on a per-file basis. Occasionally I try to go through old photos and prune the ones that aren't really interesting to save space, but admittedly it's hard to decide which you want to keep and which you don't – all of them kind of represent some fragment of a memory and it's fun to go back and recall something tiny about a trip that you had totally forgotten!

At the end of the day, I still do like the flexibility of having manual controls and being able to fix exposure issues post-taking the photo, so I'll probably keep bringing my non-phone camera on trips, but it might be just a matter of time before that too changes.


Late October

Stops-r-us

One of the annoying things about my bike ride to work is the frequency of the stops along the way, which can often make a six mile ride take upwards of 30 minutes one way. My suspicion was that a significant amount of time was spent at the Moffet & Central intersection right where the Mountain View Caltrain station was, but since I had the Strava data from a couple posts ago, I decided to take a closer at where the time was actually going.

To get an approximation of the stopping intersections along a ride, you can take advantage of the fact that Strava slows down the recording of waypoints as the device stops moving (or in other words, the time between subsequent waypoints increases while stopped). And at those stops, you can find the time spent there by taking the time difference between the next moving waypoint and the last moving waypoint at some threshold distance. From this, the data suggested that I had to stop an average of 23.4 times for a total of 7 minutes 10 seconds per commute, which is almost 25% of my total commute time!

To break that down even more, you can take the approximate intersection waypoints and cross reference them with the closest actual streets (using the Geonames API) and find out exactly how much time you are cumulatively spending at each intersection. Here are the top 15 intersections along my commute to work for example:

IntersectionTime spent waiting
Castro St & W El Camino Real 4 hours 27 minutes
California St & Castro St 4 hours 24 minutes
Central Expy & Moffett Blvd 3 hours 41 minutes
Charleston Rd & Huff Ave 3 hours 31 minutes
N Shoreline Blvd & Pear Ave 3 hours 12 minutes
Cuesta Dr & Lassen St 2 hours 51 minutes
Moffett Blvd & W Middlefield Rd 2 hours 34 minutes
Cuesta Dr & Miramonte Ave 1 hours 38 minutes
Cuesta Dr & S El Monte Ave 1 hours 31 minutes
Moffett Blvd & W Valley Fwy 1 hours 4 minutes
Castro St & Villa St 1 hour
Castro St & Miramonte Ave 58 minutes
Cuesta Dr & Tyndall St 51 minutes
Central Ave & Moffett Blvd 51 minutes
Castro St & W Evelyn Ave 47 minutes

Surprisingly, the longest time waiting isn't actually at Moffet & Central Expressway but rather at the other end of downtown Mountain View at the intersection of Castro & El Camino Real. And I believe it, that intersection also has a long wait since El Camino is such a high-traffic thoroughfare for the peninsula.

Castro and El Camino Real, the intersection where I spent most of my time on my commute
Castro & El Camino Real, the longest intersection wait time of my commute.

As a side note, if I were to sum up all the time spent at each intersection, it would be approximately 42 hours 24 minutes – that's almost two whole days spent just waiting for the cars to pass!


Late June

Socket dreams

uWSGI is one of those things in the Python world that Just Works™, I use it mainly in Emperor mode to monitor and manage the spawning of app processes but it turns out it has a full Websocket implementation, which really piqued my interest. Now that the world has largely moved onto modern browsers (with Websocket support), I thought it would be fun to test out the uWSGI implementation by making a tiny interactive visualization.

What you see above is a shared space where each heart beat line represents a visitor to this page. Clicking anywhere on the space causes your user's line to pulse, which is reflected to all other user's views (you can try it out by having two tabs open). It's a trivial visualization, but just complex enough to test it out from top to bottom, with some observations noted below:

  • Handling each socket Python isn't really built for parallelism; spawing off a new process for each connection is prohibitively memory intensive and spawning threads generally provides no benefit due to the GIL. Which really just leaves fibers/greenlets in the form of the Gevent library. Luckily, uWSGI has built in support for Gevent and they can be easily configured to work with Websockets.
  • Number of connections The visualization artificially caps the number of simultaneous connections to five, but theoretically there can be an arbitrary number of websocket connections to the server (and they are not multiplexed on the browser side like with HTTP/2 connections). And uWSGI happily sends them through, so the app really has to handle this itself. In this case, we just put the extra connections into a queued, sleeping state, waking only when it is promoted to a full connection or to send the requisite Websocket ping/pong frame to keep the connection alive.
  • Output buffering By default Nginx will buffer data before sending it to the client, and you will want to disable this by setting "proxy_buffering" to false.
  • Client messaging Like a chat room, messages from a client are received by the server and forwarded out to all the other clients. To save a bit of processing, each of the server connections also debounces messages before sending out to their respective clients. This adds latency, but it allows for reducing traffic by batching messages (for later experiments).
  • Visualization On the client side, the animation frames drive the rotation for each line, and the pulses are just animated amplitudes on the circle (radius + amplitude * periodic f(t)). I kinda like how it actually turned out!

Overall, Websockets mostly just work out of the box now, and while it's not appropriate for everything (ie. real-time, low latency is difficult on TCP), it's pretty cool to not have to fake all this with long-poll anymore.

Waterfall

Ah, the memories of MIDI

This is almost artistic, cruise ships from an ariel view

Auto-complete Bash history using arrow keys (probably the best Bash tip I know)

Pong

Remember and Big Shiny Tunes and Much Dance? Good times.

Worst office fear: Rolling over your own toes with your computer chair.

Don't say Disney won't go to great lengths to optimize their animatronics...

Like horse racing but for nerds and biologists, Genetic Cars.

Monterey 2013 (4)
Monterey 2013 (4)